
Investing in the stock market can be complex and time-consuming. Yet, MarketXLS simplifies it.
This Excel-based software provides tools for research, tracking, and investing. MarketXLS integrates real-time data updates, advanced security, and optimized data streaming directly into Excel. It helps investors make better decisions, faster. With features like live quotes, historical data, and technical analysis, MarketXLS caters to professionals and individual investors alike. Whether you’re tracking stock options or analyzing global markets, MarketXLS has you covered. Plus, with premium support and easy-to-use templates, managing your investments becomes seamless. Ready to enhance your investment strategy? Learn more about MarketXLS and its powerful features here.
Introduction To Marketxls
MarketXLS is an Excel-based software designed to simplify stock market research, tracking, and investment. It integrates real-time data updates and advanced security, making it a reliable tool for investors.
Overview Of Marketxls And Its Purpose
MarketXLS is a comprehensive solution for stock investors. Its purpose is to facilitate better research, faster decisions, and increased profits. With MarketXLS, users can access live streaming quotes, historical quotes, and over 1000 custom Excel functions.
- Real-time Data: Provides live streaming quotes and historical data.
- Enterprise-grade Service: Ideal for investment managers, RIAs, asset managers, financial analysts, and individual investors.
- Premium AI and Automatic Spreadsheet Builder: Access billions of data points with premium support.
- Options Tracking: Real-time stock options prices and streaming option chains in Excel.
- Technical Analysis: Over 100 technical indicators like Bollinger bands, moving averages, stochastics, and MACD.
- Global Coverage: Data for thousands of stocks, ETFs, mutual funds, options, and crypto symbols.
- Utilities, Templates, and Models: Pre-made stock lists, symbol lookup, industry classifications, valuation models, and more.
- Amazing Charts: Beautifully integrated charts within Excel.
- Crypto Data: Data from multiple exchanges and over a thousand crypto symbols.
- Stock Screener: Screen stocks based on hundreds of custom parameters.
Who Can Benefit From Marketxls?
MarketXLS is beneficial for various types of users:
| User Type | Benefits |
|---|---|
| Investment Managers | Enhanced ability to manage and optimize portfolios. |
| RIAs | Access to extensive financial data for informed decisions. |
| Asset Managers | Simplifies complex financial analysis and decision-making processes. |
| Financial Analysts | Automates data gathering and analysis, increasing efficiency. |
| Individual Investors | Streamlined investment research and professional support. |
MarketXLS offers a range of features designed to meet the needs of different users, making it a versatile tool for anyone involved in the stock market.
Key Features Of Marketxls
MarketXLS is an Excel-based software designed for investors, offering a suite of powerful tools to enhance investment research, tracking, and decision-making. Below are the key features that make MarketXLS an invaluable asset for traders and investors.
MarketXLS provides real-time data integration directly into Excel. Users can access live streaming quotes, historical quotes, and fundamental data. This feature supports over 1000 custom Excel functions, making it easy to keep up with market changes.
- Live streaming quotes
- Historical quotes
- Fundamental data
MarketXLS offers advanced analytics with over 100 technical indicators such as Bollinger bands, Moving averages, stochastics, and MACD. It also includes valuation models and other financial tools, helping users perform detailed analysis and make informed decisions.
- Bollinger bands
- Moving averages
- Stochastics
- MACD
With MarketXLS, users can create customizable dashboards and reports tailored to their specific needs. The software includes pre-made stock lists, symbol lookups, and industry classifications. This helps in organizing and presenting data effectively.
- Pre-made stock lists
- Symbol lookup
- Industry and sector classifications
The stock screener feature allows users to screen stocks based on hundreds of custom parameters. This facilitates enhanced investment research and helps in identifying potential investment opportunities quickly.
- Screen stocks with custom parameters
- Identify potential investments
MarketXLS seamlessly integrates with Excel, offering users an intuitive and familiar interface. This integration simplifies complex financial analysis and decision-making processes. The software also automates data gathering and analysis, increasing efficiency.
- Seamless Excel integration
- Intuitive interface
- Automates data gathering and analysis
For more detailed information about MarketXLS, visit their website.
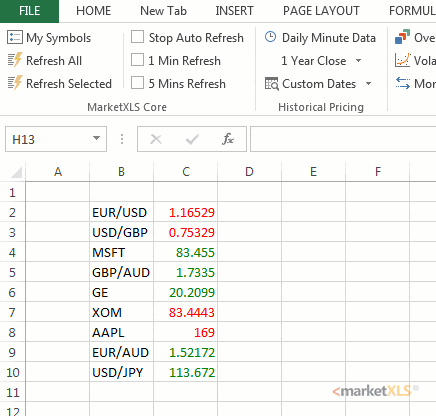
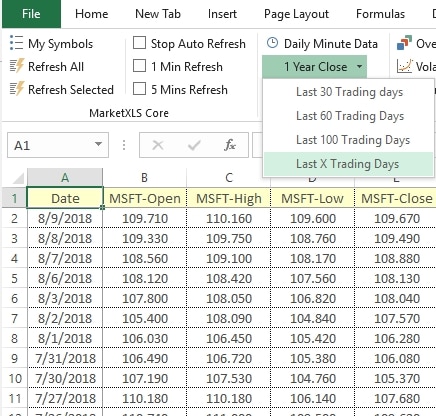
Real-time Data Integration
MarketXLS integrates real-time data directly into Excel, providing investors and traders with up-to-the-minute financial information. This feature is essential for making informed investment decisions and staying ahead of market trends. Let’s delve into how MarketXLS offers real-time data integration and its benefits.
Accessing Up-to-the-minute Financial Data
With MarketXLS, users can access live streaming quotes and historical data for over 13,574 stocks, 3,119 ETFs, 26,802 mutual funds, and millions of options. The platform also supports real-time stock options prices and streaming option chains. MarketXLS provides data from 17 exchanges and 1,200 crypto symbols, ensuring comprehensive global coverage.
Here are some key features of MarketXLS’s real-time data integration:
- Live streaming quotes and historical data
- Real-time stock options prices and option chains
- Data for a wide range of financial instruments
- Global coverage with data from multiple exchanges
How Real-time Data Enhances Decision Making
Real-time data integration in MarketXLS enhances decision-making by providing timely and accurate financial information. Users can analyze market trends and make informed decisions quickly. This is crucial for traders and investors who need to act fast to capitalize on market opportunities.
Some benefits of real-time data integration include:
- Improved portfolio management and optimization
- Enhanced ability to track and analyze market trends
- Faster and more accurate decision-making
- Reduced reliance on outdated information
MarketXLS simplifies complex financial analysis and decision-making processes, making it easier for users to focus on strategic decisions. With its comprehensive data access, premium support, and powerful tools, MarketXLS is an invaluable asset for any investor.
Advanced Analytics And Financial Models
MarketXLS offers advanced analytics and financial models to enhance your investment research and decision-making. This tool integrates seamlessly with Excel, providing real-time data, technical analysis, and customizable models. Investors and analysts can leverage these features to streamline their workflow and improve accuracy.
Pre-built Financial Models For Quick Analysis
MarketXLS includes a variety of pre-built financial models designed for quick and efficient analysis. These models help you evaluate stocks, options, and other financial instruments with ease.
- Valuation models for assessing stock worth
- Options pricing models for accurate options tracking
- Technical indicators like Bollinger bands and MACD
Each model is crafted to deliver precise insights, enabling you to make informed investment decisions faster. With these tools, you can save time and focus on strategic analysis rather than data gathering.
Customizing Analytics To Fit Your Needs
MarketXLS allows you to customize analytics to suit your specific requirements. You can modify existing models or create new ones using the platform’s extensive library of functions.
Here are some ways you can tailor the analytics:
- Adjust parameters in pre-built models
- Create custom indicators and formulas
- Integrate real-time and historical data seamlessly
This flexibility ensures that your analysis is not only comprehensive but also aligned with your investment strategy. Whether you are an individual investor or a financial analyst, MarketXLS provides the tools you need for precise and personalized financial analysis.
| Feature | Benefit |
|---|---|
| Real-time Data Integration | Stay updated with live market data |
| Customizable Models | Adapt models to your unique needs |
| Technical Analysis Tools | Utilize over 100 technical indicators |
Customizable Dashboards And Reports
MarketXLS allows you to create customizable dashboards and reports that cater to your specific investment needs. This feature is designed to provide a seamless experience for investors and analysts, enabling them to make faster and more informed decisions.
Creating Personalized Dashboards
With MarketXLS, you can design dashboards tailored to your investment strategies. Utilize various widgets and data points to monitor key metrics. Customize these dashboards to reflect your unique preferences and requirements.
- Drag-and-drop interface for easy customization.
- Real-time data integration for up-to-date insights.
- Over 100 technical indicators to choose from.
Here is an example of a personalized dashboard setup:
| Widget | Description |
|---|---|
| Stock Ticker | Displays real-time stock quotes. |
| Technical Indicators | Shows Bollinger bands, Moving averages, etc. |
| Portfolio Overview | Summarizes your portfolio performance. |
Automating Financial Reports
MarketXLS simplifies the creation of financial reports with its automation features. Generate comprehensive reports with just a few clicks, saving you time and effort.
- Set up report templates based on your needs.
- Automate data collection from multiple sources.
- Generate reports at scheduled intervals.
Automating reports ensures accuracy and consistency, allowing you to focus on strategic decisions. Here are some key benefits:
- Reduces manual errors.
- Provides consistent data for analysis.
- Saves time for critical tasks.
MarketXLS’s customizable dashboards and automated reports are designed to enhance your investment research and decision-making process.
Credit: marketxls.com
Investment Research And Stock Screening
MarketXLS provides powerful tools for investment research and stock screening. Investors can make better decisions using real-time data and advanced features.
Comprehensive Research Tools
With MarketXLS, you get access to a wide range of comprehensive research tools. These tools include:
- Real-time Data: Live streaming quotes, historical quotes, and fundamentals with over 1000 custom Excel functions.
- Technical Analysis: Over 100 technical indicators like Bollinger bands, Moving averages, stochastics, MACD.
- Global Coverage: Data for thousands of stocks, ETFs, mutual funds, options, crypto symbols, and more.
These tools help you analyze market trends and make informed decisions.
Efficient Stock Screening Techniques
MarketXLS offers efficient stock screening techniques that allow you to filter stocks based on hundreds of parameters. This includes:
- Real-time stock options prices.
- Streaming option chains in Excel.
- Pre-made stock lists.
- Industry and sector classifications.
Using these techniques, you can quickly identify stocks that meet your investment criteria. The advanced screening options make it easier to find potential investments that align with your strategy.
MarketXLS not only simplifies data gathering but also enhances your ability to manage and optimize your portfolio.
Excel Integration And Ease Of Use
MarketXLS is a powerful tool designed for investors and traders. It simplifies complex financial analysis with its seamless integration with Microsoft Excel. Users can leverage its rich features to enhance their stock market research and investment decisions.
Seamless Integration With Microsoft Excel
MarketXLS integrates smoothly with Microsoft Excel, allowing users to access real-time data directly within their spreadsheets. This integration means that users do not need to switch between different platforms. Instead, they can perform all their analysis in a familiar environment.
Key integration features include:
- Real-time Data: Live streaming quotes and historical quotes.
- Technical Analysis: Over 100 technical indicators like Bollinger bands and MACD.
- Options Tracking: Real-time stock options prices and streaming option chains.
| Feature | Description |
|---|---|
| Real-time Data | Live streaming quotes, historical quotes, and fundamentals. |
| Technical Analysis | Indicators such as Bollinger bands, Moving averages, MACD. |
| Options Tracking | Real-time stock options prices and streaming option chains. |
User-friendly Interface And Learning Curve
MarketXLS offers a user-friendly interface that makes it easy for both novice and experienced users to navigate. The platform is designed to minimize the learning curve, ensuring users can quickly get up to speed and start making informed decisions.
Key usability features include:
- Intuitive Layout: Easy access to functions and tools.
- Pre-made Templates: Ready-to-use stock lists, valuation models, and more.
- Professional Support: Premium support via phone, chat, or email.
Users also benefit from a comprehensive set of educational resources, including 97 videos and extensive online documentation. This support ensures that even those new to stock market investing can effectively use the tool.
MarketXLS helps in:
- Streamlining investment research.
- Providing access to extensive financial data.
- Simplifying the decision-making process.
MarketXLS is designed to cater to the needs of financial analysts, investment managers, and individual investors. Its integration and ease of use make it an invaluable tool for anyone looking to optimize their investment strategies.
Credit: marketxls.com
Pricing And Affordability
MarketXLS offers a range of features that are ideal for both individual investors and financial professionals. Understanding the pricing and affordability of MarketXLS is essential to determine its value for your needs. This section will break down the subscription plans and evaluate the cost-effectiveness of this powerful Excel-based stock solution.
Marketxls Subscription Plans
MarketXLS provides various subscription plans designed to cater to different user requirements. These plans ensure that every investor, whether an individual or a professional, finds a suitable option:
| Plan | Features |
|---|---|
| Basic |
|
| Premium |
|
| Enterprise |
|
Evaluating The Cost-effectiveness
When evaluating the cost-effectiveness of MarketXLS, consider the extensive range of features it offers:
- Real-time Data: Access to live streaming quotes and historical data provides up-to-date information for better decision-making.
- Professional Support: Premium support ensures quick resolution of issues and queries, enhancing user experience.
- Automation: Automated data gathering and analysis save time and reduce manual effort.
- Comprehensive Coverage: Data for thousands of stocks, ETFs, mutual funds, options, and crypto symbols.
MarketXLS’s pricing structure ensures that the value received from the features outweighs the cost. The plans are designed to offer flexibility and cater to different levels of investment and analysis needs. By choosing the right plan, users can maximize their investment research and decision-making efficiency.
Pros And Cons Of Marketxls
MarketXLS is a powerful Excel-based tool designed for stock market investors. It offers real-time data, advanced features, and a seamless Excel integration. Let’s explore the pros and cons of using MarketXLS.
Advantages Of Using Marketxls
- Real-time Data: Live quotes, historical data, and over 1000 custom Excel functions.
- Enterprise-grade Service: Suitable for various finance professionals, including Investment Managers and Financial Analysts.
- Premium AI and Automatic Spreadsheet Builder: Access to billions of data points with premium support via phone, chat, or email.
- Options Tracking: Real-time stock options prices and streaming option chains in Excel.
- Technical Analysis: Over 100 technical indicators like Bollinger bands, Moving averages, stochastics, and MACD.
- Global Coverage: Data for thousands of stocks, ETFs, mutual funds, options, crypto symbols, and more.
- Utilities, Templates, and Models: Includes pre-made stock lists, symbol lookup, industry and sector classifications, valuation models, and more.
- Amazing Charts: Beautifully integrated charts within Excel for better visualization.
- Crypto Data: Data from 17 exchanges and 1,200 crypto symbols.
- Stock Screener: Screen stocks based on hundreds of custom parameters.
- Streamlined Investment Research: Enhanced ability to manage and optimize portfolios.
- Ease of Use: Simplifies complex financial analysis and decision-making processes.
- Professional Support: Premium support available through multiple channels.
- Increased Efficiency: Automates data gathering and analysis, allowing users to focus on strategic decisions.
Potential Drawbacks To Consider
- Pricing Details: Specific pricing information is not provided upfront. Users need to “Buy Now” or “Book a Demo” for more details.
- Refund Policy: A refund policy is mentioned, but specific details are not provided. Users should refer to the company’s Refund Policy document.
- Complexity: The range of features might be overwhelming for beginners or non-professional investors.
Recommendations For Ideal Users
MarketXLS is a powerful tool tailored for those deeply involved in the stock market. Its comprehensive features make it suitable for various types of users. Whether you are managing portfolios or conducting detailed financial analysis, MarketXLS offers the tools you need.
Best Use Cases For Marketxls
- Investment Managers: Utilize real-time data and advanced security to manage large portfolios.
- Financial Analysts: Perform detailed technical analysis with over 100 indicators.
- Individual Investors: Track stock options and create custom investment strategies.
- Crypto Enthusiasts: Access data from 17 exchanges and analyze 1,200 crypto symbols.
The capabilities of MarketXLS make it an excellent choice for various financial professionals and enthusiasts.
Who Should Consider Using Marketxls?
MarketXLS is ideal for the following users:
| User Type | Why MarketXLS is Suitable |
|---|---|
| Investment Managers | Real-time data and advanced security for managing portfolios efficiently. |
| RIAs and Asset Managers | Enterprise-grade service and comprehensive data access to support decision-making. |
| Financial Analysts | Over 100 technical indicators and automatic spreadsheet builders for detailed analysis. |
| Individual Investors | Ease of use and powerful tools to streamline investment research. |
| Crypto Traders | Access to extensive crypto data for informed trading decisions. |
MarketXLS caters to diverse needs, making it a versatile tool for anyone involved in the stock market and beyond.
Credit: marketxls.com
Frequently Asked Questions
What Is Marketxls Used For?
Marketxls is used for financial analysis and stock market research. It integrates with Excel to provide real-time data and powerful tools.
How Does Marketxls Work?
Marketxls works by integrating with Microsoft Excel. It provides access to real-time stock data, analytics, and financial modeling tools.
Can Marketxls Track Real-time Stock Data?
Yes, Marketxls can track real-time stock data. It offers live market prices and historical data for informed decision-making.
Is Marketxls Suitable For Beginners?
Yes, Marketxls is suitable for beginners. Its user-friendly interface and extensive support make it easy to use.
Conclusion
MarketXLS offers a powerful tool for investors. The software provides real-time data, advanced analytics, and professional support. Users benefit from streamlined research and comprehensive data access. MarketXLS simplifies complex financial analysis, making it ideal for all levels of investors. Explore MarketXLS to enhance your investment strategies. For more information, visit MarketXLS today.